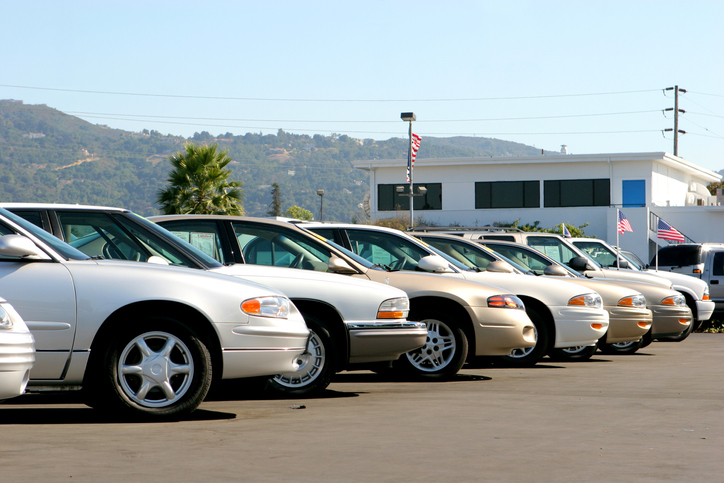
(iSeeCars) – The global microchip shortage has drastically impacted the automotive industry. Nearly every major automaker has been forced to idle production, which has led to a dramatic reduction in new car inventory. As a result, demand for used cars has soared, and prices for used cars have risen proportionately.
How much have used car prices gone up? According to iSeeCars.com’s latest analysis of over 1.2 million used car sales, used car prices have increased 16.8 percent, or $3,926, compared to the same period the previous year. This is compared to a 0.2 percent increase in 2020 over 2019.
Used Car Price Increases by State
Are used car price increases consistent across the country? Here are the average used car price increases by state:
| Used Car Price Increases by State | |||
| Rank | State | Year-Over-Year % Price Change | Year-Over-Year $ Price Change |
| 1 | Vermont | 10.7% | $2,717 |
| 2 | New Jersey | 11.1% | $2,580 |
| 3 | West Virginia | 11.8% | $2,910 |
| 4 | Nebraska | 12.1% | $2,968 |
| 5 | Wisconsin | 12.3% | $3,026 |
| 6 | Minnesota | 12.4% | $2,945 |
| 7 | Iowa | 12.7% | $3,135 |
| 8 | Hawaii | 13.3% | $3,391 |
| 9 | New York | 13.7% | $3,126 |
| 10 | New Hampshire | 13.8% | $3,106 |
| 11 | Massachusetts | 14.1% | $3,188 |
| 12 | Indiana | 14.1% | $3,247 |
| 13 | Connecticut | 14.2% | $3,000 |
| 14 | Pennsylvania | 14.3% | $3,214 |
| 15 | New Mexico | 14.4% | $3,444 |
| 16 | Colorado | 14.6% | $3,554 |
| 17 | North Dakota | 14.9% | $4,062 |
| 18 | Illinois | 14.9% | $3,575 |
| 19 | Idaho | 15.0% | $4,067 |
| 20 | Oklahoma | 15.9% | $3,895 |
| 21 | Texas | 16.0% | $3,890 |
| 22 | Mississippi | 16.1% | $3,892 |
| 23 | Louisiana | 16.6% | $3,883 |
| 24 | North Carolina | 16.7% | $3,882 |
| 25 | Kansas | 16.8% | $3,950 |
| 26 | Maine | 16.8% | $3,977 |
| National Average | 16.8% | $3,926 | |
| 27 | Delaware | 17.3% | $3,652 |
| 28 | Virginia | 17.3% | $3,883 |
| 29 | Michigan | 17.7% | $4,051 |
| 30 | South Dakota | 18.1% | $4,998 |
| 31 | Kentucky | 18.3% | $4,196 |
| 32 | Missouri | 18.4% | $4,338 |
| 33 | South Carolina | 18.5% | $4,283 |
| 34 | Alabama | 18.5% | $4,304 |
| 35 | California | 18.7% | $4,296 |
| 36 | Maryland | 19.1% | $4,142 |
| 37 | Florida | 19.2% | $4,224 |
| 38 | Ohio | 19.2% | $4,102 |
| 39 | Alaska | 19.3% | $5,907 |
| 40 | Washington | 19.4% | $4,664 |
| 41 | Tennessee | 19.4% | $4,539 |
| 42 | Wyoming | 19.6% | $6,173 |
| 43 | Oregon | 20.2% | $4,738 |
| 44 | Arkansas | 20.4% | $4,994 |
| 45 | Arizona | 20.5% | $4,600 |
| 46 | Utah | 21.0% | $4,729 |
| 47 | Montana | 21.8% | $5,926 |
| 48 | Georgia | 22.2% | $5,100 |
| 49 | Nevada | 22.3% | $4,852 |
| 50 | Rhode Island | 25.5% | $5,559 |
- iSeeCars used car pricing analysis shows that consumers may be able to get a better used car deal by crossing state lines.
- Rhode Island is the state with the greatest used car price increase in 2021 compared to 2020 at 25.5 percent, which amounts to $5,559.
- Another New England state, Vermont, has the smallest used car price increase at 10.7 percent, which amounts to $2,717.
- Of the top 10 states with the lowest price increases, five are Eastern states and four are in the Midwest.
- Of the 10 states with the highest price increases, six are Western states, and four are Eastern.
What does this mean for consumers? The rise in used car prices presents lucrative trade-in opportunities for consumers who can get rid of a vehicle entirely or who are willing to trade one in for a less in-demand vehicle. For example, selling a pickup truck or trading in a large SUV for a smaller one can leave consumers with extra cash in their pockets. For shoppers who are in the market for a used car, not all vehicles have had significant price increases. Many small SUVs, hatchbacks, and sedans can be found in the used car marketplace that won’t give consumers sticker shock. And for used car shoppers who are willing to travel, you may find a better deal on a used car in a nearby state. A full list of the best and worst used cars to buy right now can be found in iSeeCars detailed analysis of used car prices.
More from iSeeCars.com:
- Best Cars to Buy, Worst Cars to Sell
- Most Popular New and Used Cars in Every State
- Cars Owners Keep the Longest
About iSeeCars.com
iSeeCars.com is a car search engine that helps shoppers find the best car deals by providing key insights and valuable resources, like the iSeeCars free VIN check reports. iSeeCars.com has saved users over $282 million so far by applying big data analytics powered by over 25 billion (and growing) data points and using proprietary algorithms to objectively analyze, score and rank millions of new cars and used cars.
This article, Here’s How Much Used Car Prices Have Gone Up in Each State, originally appeared on iSeeCars.com.